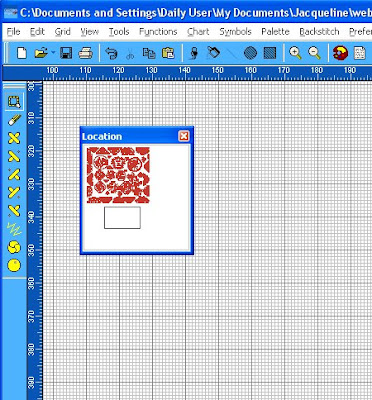
It has happened to me once or twice, long ago, that when I opened up a chart I saw - it had vanished! I missed a heartbeat or two, fearing the chart was lost or corrupted. Then I discovered Locator Window. This is how to use it. On the top tool bar click on View then run down the menu and click on Locator Window.

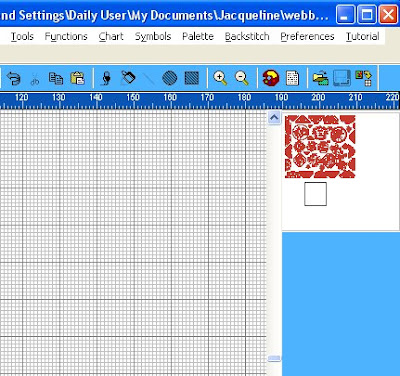
Now you should be able to see a clump of colour in the window which is your chart - just hiding in the big expanse of spare design space you have. The rectangle defines your active viewing space so just push the rectangle over the clump of colour and your chart will appear before your very eyes. The locator window will stay with you until you dismiss it by clicking on the cross to close it.

If you want it to be there the next time you open your chart, so you don't go into crashcart mode again, you can simply park it out of the way on the area to the right of your screen. try it now for yourself.


No comments:
Post a Comment