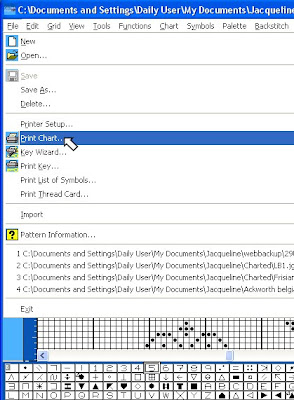
 Tonight I am going to go through some basic steps which will allow you to print your chart. The print facility has quite a few options, but at first let's go with some basic assumptions the progam makes until you get the hang of things, then I'll talk you through how you can customize your printing to suit your own personal preferences. So the first thing to do, if you have a black and white printer, is to review last night's post and then change your file from colour to symbols. If you have a colour printer, then you can simply leave your chart in colour mode. Select File from the top Tool Bar, then look down for the Print option on the menu.
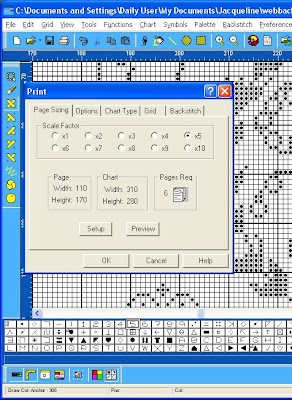
You will now have a pop up table which is bristling with options. You don't need to understand them all at once to run off a basic print. The software is making some reasonable assumptions and let's just go with those for now. But have a look at the first set of options that are uppemost here. The main choice to be made is the Scale Factor or degree of magnification you require for your chart. Just run through checking on the different circles and as you do that look below at the panel which tells you how many pages you will require for printing at that magnification. When you have done that choose the default Scale Factor 5. Now look at the two panels to the left of the Pages Required Panel. You will see that for Page and Chart there are two values given - these are small square counts - you can think of them as stitch counts if that helps. You will see for the Chart that the square count is 310 x 280 which is slightly more than the stitch count, since there will be a border added around the stitching. This number will not change when you change the Scale Factor, unlike the count for the page which will change. The higher the Scale Factor - the higher the degree of magnification - then the lower the Page counts will be. Try it out for yurself. Then put the Scale Factor back to 5 again. The important thing to point out to you is that there will be no overlaps on your chart pages.
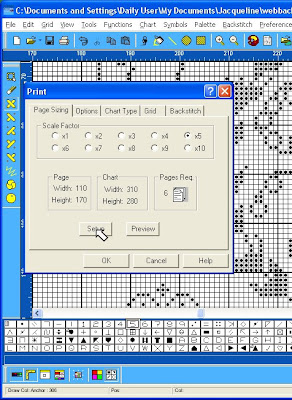
Well, let's just see what these defaults look like when used to print a sample of your chart. First you need to tell the software something about your printer, so click on Setup.
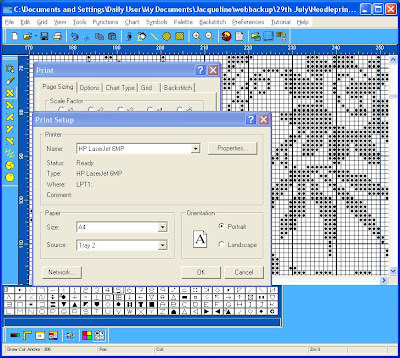 Identify your printer from the options and make sure the feed is from the right tray etc. When you are happy you are all set up - and you have your printer switched on, haven't you? - then click OK.
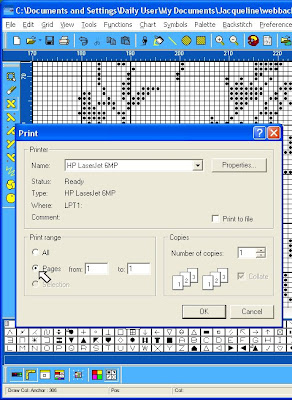 Why waste paper for a trial. Just click on the Print Range option to set up for printing the first page only. Then if you are happy, you can come back and print off the other pages.
We'll look at a few more useful print options tomorrow night.



No comments:
Post a Comment