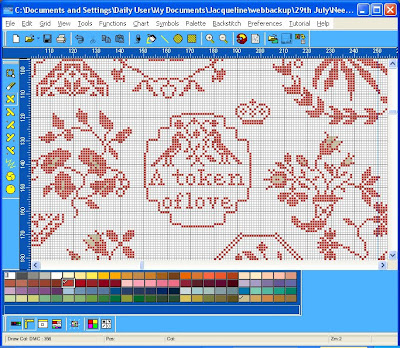
In the next few posts we shall be putting together the building blocks which will enable you to print out a useful working copy of your chart. For many of you it was quite a new, and perhaps awkward, experience to have to work from the upper left corner of a chart when commencing your Mary Wigham sampler - many of us are so accustomed to beginning at the centre. But centre lines are useful whether you print out your chart or work from the screen. And in this post we shall concentrate on locating and marking the exact centre of your chart.
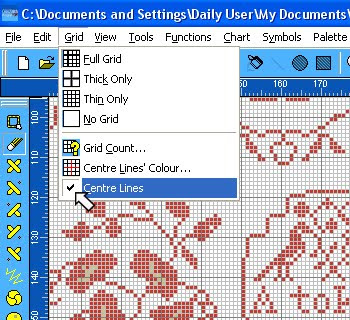
The first step is to check that we have centre lines in place. Look at the top Tool Bar, towards the left, and choose Grid. If you browse this menu you can see that there a number of general grid options to explore - whether to have no grid, a thin grid (with no periodic marking of a defined number of stitches), a thick grid (with only the periodic marking) or a full grid with thin and thick lines marking off defined blocks of stitches - and no, it doesn't have to be blocks of 10, choose Grid Count and you can change to any number to suit your own preference. Play around with these options and see what help they might be to you. Now look at the bottom box labelled Centre Lines (yes, we do spell things funny in the UK if you come from the US, but not if you come from France....or the UK!)Make sure the Centre Lines Box is checked.
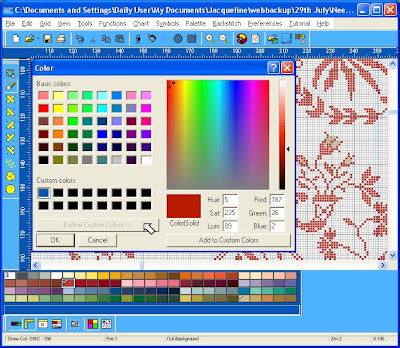
This will give you a cross hair through the centre of your chart. And look up a little and you will see that you can specify the colour of this cross hair to whatever colour on the spectrum will grab your attention best. Choose the colour you prefer.
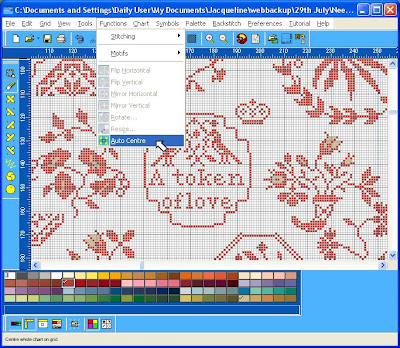
Now we have centre lines on the chart - if you cannot see them, use your Locator Window (which you found in the View menu in an earlier lesson) to home in on them. Now all we have to do is to find the right place on the chart for the lines to intersect so you have marked the centre. Simple! Just begin counting, very carefully, each individual square from the left, ..... OK I'm joking! This time go to the top Tool Bar and chose Functions and the moment you do, out pops a menu and right at the bottom it says Auto Centre. Magic! Click on that and you will see the chart whizz off and do exactly what it says on the Menu.
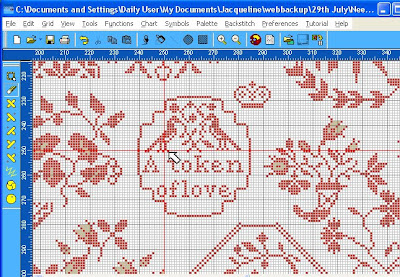
How easy is that? Isn't it good to be in control?


No comments:
Post a Comment