I do apologise, I am working away from home and don't have the Jane Greenoff software loaded on my laptop, so I can't show you what I wanted to tonight. However, before you throw your jolly old Panama hats up into the jolly old air, this is not a declaration of holiday. Oh no. You know those streaming, wet days at school, when you thought you would be let off churning up a boggy hockey pitch and could pull out a novel in the library to read in peace in quiet....what happened, then? It was 15 times round the hockey pitch, start sprinting now, while the games mistress looked admiringly at your mud splashed, livid chapped knees from under the cover of the games pavilion while sipping from a flask of hot cocoa, wasn't it? Exactly. But it is all for your own good, believe me. And what you can do tonight is just one whole barrel of fun and when you are through you will be thinking, that was jolly character forming, thank you, Jacqueline.
Last night we looked at printing your chart and if you return to those first instructions you will see a little further up the menu the option to print the list of Symbols. OK, so do that. Now you have that printed out, go through all the symbols and just black out all the nasties, symbols you wouldn't like inflicted on you, if you were working from a chart. Now you have an easy-to-find working set. Save this list somewhere safe, but before you do, have a spring clean of your symbol palette and you will save yourself literally hours of frustration and toing and froing at later dates.
When you are charting the chances are you are not going to use more than 20 colours maximum. So, open up a new file : File:New and save this chart as New Chart Template. Switch this chart into symbol mode and starting one symbol away from the Background colour on the top left of your palette, go through the first 20 symbols working to the right and exchange each of them for a more legible symbol from your list. If you need to revise how to do this, see the post a couple of days ago entitled Going Symbolic. When you have done this, save your chart. Now every time you set to work on a new project, open up New Chart Template and immediately save it as ProjectName. Set up your colours in the first 20 palette places and you will never have to go hunting for printable symbols again. See, I told you it would put roses in your cheeks! (or your knees...)
Wednesday, 29 September 2010
Saturday, 25 September 2010
Basic Print Options for Your Infinity Charts
 Tonight I am going to go through some basic steps which will allow you to print your chart. The print facility has quite a few options, but at first let's go with some basic assumptions the progam makes until you get the hang of things, then I'll talk you through how you can customize your printing to suit your own personal preferences. So the first thing to do, if you have a black and white printer, is to review last night's post and then change your file from colour to symbols. If you have a colour printer, then you can simply leave your chart in colour mode. Select File from the top Tool Bar, then look down for the Print option on the menu.
You will now have a pop up table which is bristling with options. You don't need to understand them all at once to run off a basic print. The software is making some reasonable assumptions and let's just go with those for now. But have a look at the first set of options that are uppemost here. The main choice to be made is the Scale Factor or degree of magnification you require for your chart. Just run through checking on the different circles and as you do that look below at the panel which tells you how many pages you will require for printing at that magnification. When you have done that choose the default Scale Factor 5. Now look at the two panels to the left of the Pages Required Panel. You will see that for Page and Chart there are two values given - these are small square counts - you can think of them as stitch counts if that helps. You will see for the Chart that the square count is 310 x 280 which is slightly more than the stitch count, since there will be a border added around the stitching. This number will not change when you change the Scale Factor, unlike the count for the page which will change. The higher the Scale Factor - the higher the degree of magnification - then the lower the Page counts will be. Try it out for yurself. Then put the Scale Factor back to 5 again. The important thing to point out to you is that there will be no overlaps on your chart pages.

Well, let's just see what these defaults look like when used to print a sample of your chart. First you need to tell the software something about your printer, so click on Setup.
 Identify your printer from the options and make sure the feed is from the right tray etc. When you are happy you are all set up - and you have your printer switched on, haven't you? - then click OK.
 Why waste paper for a trial. Just click on the Print Range option to set up for printing the first page only. Then if you are happy, you can come back and print off the other pages.
We'll look at a few more useful print options tomorrow night.
Thursday, 23 September 2010
Going Symbolic!

If you don't have a colour printer and you want to work from a hard copy of your chart, then you will need to convert your chart from coloured blocks to black and white symbols. The way to do this is to go to the top Tool Bar and click on Chart. Now when the menu drops down you will see the B/W Symbols option. Click on this and the moment you do so your chart is magically transformed into black and white symbols ready for you to print off.

To change any symbol is like changing a colour. You simply double click on the symbol key in the palette and you will be given a menu offering you a choice of symbols - and it kindly tells you which symbols you already have in use on your chart. To change the symbol, double click on a new symbol from the menu and the symbol on the chart will change but the symbol on your palette remains unchanged - how perplexing is that. Hmmm! It is only when you click on another symbol key on your palette that the last change you made is registered. I am a charitable person and try to see the logic in everything. Try as I may, I can see no logic here at all and it is just something like freckles that I have learnt to live with.

The useful thing about the Beatrix Potter chart you have is that there are only two colours - red and ecru and the symbols are set to a dot and a triangle which are easily distinguishable. If you don't like dots and triangles, then you can change - there are 200 symbols in the library. But please, please there are some symbols there that should never, ever see light of day on a chart. Select symbols with clear, clean, simple shapes. Avoid any symbols with more than one dot or three lines - and I never personally use numbers. If you think I have left you with no choice after that, then I will make amends later when I show you how you can make your own custom symbols. But that is after we print out our first chart tomorrow.
Wednesday, 22 September 2010
Locating the Centre of Your Chart

In the next few posts we shall be putting together the building blocks which will enable you to print out a useful working copy of your chart. For many of you it was quite a new, and perhaps awkward, experience to have to work from the upper left corner of a chart when commencing your Mary Wigham sampler - many of us are so accustomed to beginning at the centre. But centre lines are useful whether you print out your chart or work from the screen. And in this post we shall concentrate on locating and marking the exact centre of your chart.

The first step is to check that we have centre lines in place. Look at the top Tool Bar, towards the left, and choose Grid. If you browse this menu you can see that there a number of general grid options to explore - whether to have no grid, a thin grid (with no periodic marking of a defined number of stitches), a thick grid (with only the periodic marking) or a full grid with thin and thick lines marking off defined blocks of stitches - and no, it doesn't have to be blocks of 10, choose Grid Count and you can change to any number to suit your own preference. Play around with these options and see what help they might be to you. Now look at the bottom box labelled Centre Lines (yes, we do spell things funny in the UK if you come from the US, but not if you come from France....or the UK!)Make sure the Centre Lines Box is checked.

This will give you a cross hair through the centre of your chart. And look up a little and you will see that you can specify the colour of this cross hair to whatever colour on the spectrum will grab your attention best. Choose the colour you prefer.

Now we have centre lines on the chart - if you cannot see them, use your Locator Window (which you found in the View menu in an earlier lesson) to home in on them. Now all we have to do is to find the right place on the chart for the lines to intersect so you have marked the centre. Simple! Just begin counting, very carefully, each individual square from the left, ..... OK I'm joking! This time go to the top Tool Bar and chose Functions and the moment you do, out pops a menu and right at the bottom it says Auto Centre. Magic! Click on that and you will see the chart whizz off and do exactly what it says on the Menu.

How easy is that? Isn't it good to be in control?
Monday, 20 September 2010
How Would Beatrix Look in Lace
 Changing the colour of threads and linens on charts is a bold move and not for the anxious wondering what will be done with all that thread and fabric, not to mention a bruised ego, if it doesn't quite work...nnnnnn. This is where Infinity charting can really help you. Without spending a penny - I'll rephrase that - without any outlay at all, you can try out various colour combinations and mull them over. Every time you change a colour on your chart, save it with a visual clue name like: BP red; BP multi indigo.. here I go again teaching you to suck eggs. We have recently seen some white lace versions of Mary Wigham. Well, how would Beatrix look in lace? Shall we see? The first obvious thing is that if you change the red to white on Beatrix, how on earth do you see it? Well, would you stitch white thread on white linen? Probably not, so we don't have to graph our white stitches on a white background, we can change the background to any shade present on any of the thread palettes. Let's do it now.
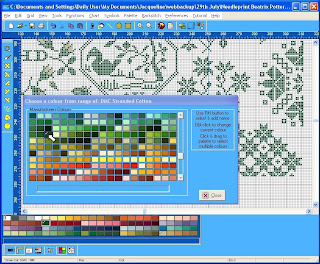
See the B in the first palette colour - that is for Background. Double click on it and hunt around for a background shade that matches some dark linen you already have, or some that you LNS can get for you.

As soon as you make your choice the background will change. Now all you have to do is change the red we used for thread shade on the palette to white or ecru.
 Mmmmm - what do you think? Do you want to change the white infills left from the original to your shade of ecru now? Do you want to pick a different shade for the linen? Off you go - you are the designer now.
 Sunday, 19 September 2010
Make Pattern Information Work for You
(Warning - I am going to SHOUT. Keep a stiff upper lip and remember it is for your own good - you will thank me one day.) 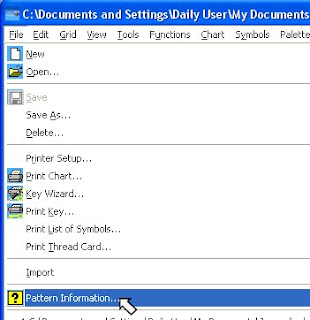 The first questions I am asked whenever we are about to release a chart, after what colours shall we buy, is: If I stitch it on 35 count instead of 32 count, how much linen do I need; If I stitch over one, how much less thread will I need..... it is obvious that before you embark on stitching your customized design, you need to see exactly what it will entail. I have laboriously crafted perfectly divine designs, and then I look at the total stitch count and blanche and think, well not in my life-time! So, here are some tips for getting useful information about the chart you have on your desk top.
First click on File at the top left of your toolbar and skim down the menu until near the bottom you see the yellow question mark and Pattern Information. You are going to click on that.


First click on File at the top left of your toolbar and skim down the menu until near the bottom you see the yellow question mark and Pattern Information. You are going to click on that.

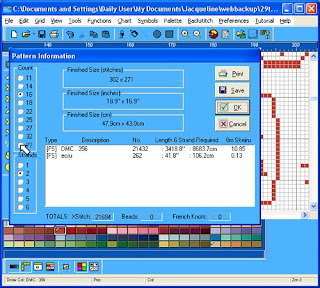
What you see initially are assumptions about how you will stitch your chart and probably none of them will be any good to you, so you need to change them. But first let's spend a moment looking at the information you are given so you can see what is available. Right at the bottom on the left you see Totals: Xstitch then many thousands of stitches. Still want to do it? Now's the time to go back and use the lasso and delete key. OK, back to the top. The first box is finished size - here it tells you that the Beatrix Potter sampler is 302 stitches BROAD by 271 LENGTH (remember B before L). The finished size is 18.9 inches B by 16.9 inches L - and the dimensions are repeated in metric. But hold on a minute! Don't those sizes depend on thread count and whether you are stitching over one? Heavens to Murgatroyd! Indeed they do. The first and most important and most critical thing you will ever remember about this software - and you will only forget it once to your peril - is that these dimensions are based on stitching over 1. They are ALWAYS based on stitching over 1. What do you have to do if you stitch over 2? You 2ple it. So unless you plan to stitch over 1, you must ALWAYS DOUBLE those dimensions to arrive at the amount of linen you will need. You will never, ever forget to DOUBLE when working over 2, now, WILL YOU?
But don't those dimensions also depend on thread count? You are absolutely right. Look down the left hand side of the panel and you will see choices for thread count. At the moment it is set to 16. Is that what you plan, or something else? Look down the column and find your desired thread count. Hold on a minute, where is the 78? OK. Right at the bottom you see ??, click on this and you get another panel which allows you to specify whatever thread count you want in inches or centimetres. It is for even weave, so for uneven weaves specify for the LESSER of the two thread counts, UNLESSER you want to run out of fabric on one side. Hard bit done now.
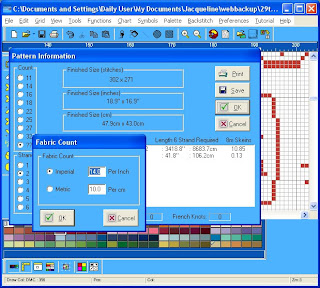
All you have to do is read off the amount of thread you need. Check the options for strands beneath the thread count options. You can use up to 6 strands in your needle at once if you really must. And what happens if you don't have all that thread in one colour - well, you could jump in your car, burn up the (millenia) old fossil fuel and go out to buy some more thread (and gas) - or you could think that maybe if you just substituted the colour of a motif here and there, you will have plenty of thread in your stash to manage. This is how you can make Pattern Information work for you. Because after all, since you paid for the chart, Infinity charting puts you where you should be, in control. YES!
Saturday, 18 September 2010
Matching the colour palette to your stash

We all have thread stash which begs to be used, but the patterns we buy never seem to demand it. Well, using Infinity charts we can pick our favourite threads from our stash, match to any nearest colour sample on the Cross Stitch Designer colour palette, and change the name of that colour to the name and shade of our own thread. Here is how we do it:

When you double click on any colour on the palette you will be presented with a number of thread brands such as DMC or Anchor. You can use these, but you may want to specify your own thread brands. So, let's just choose a brand at randon, DMC.
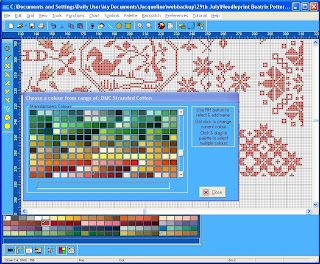
Click on it to open up all the colour options, and now find a colour which approximates to the thread in our own stash. OK you may have hand-dyed thread, that is tricky, but find something as close as possible.
When you have made your choice, double click, and the colour on your palette will change, along with any stitches on the chart that used the old colour.
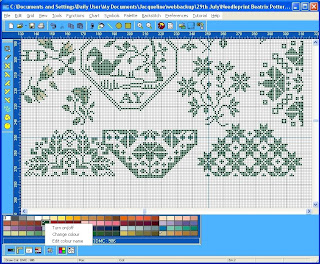
Now right click on the colour you have chosen and you will be given the option to rename it.
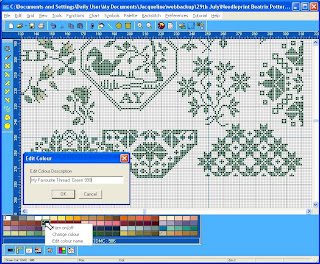
Choose that option and a little tab pops up so you can enter your thread name and shade. Now when you come to print out the thread information for stitching your chart, you will have a list of your threads and the amounts you require of each. So, tomorrow, we will look at how you produce that list. And it won't be a jaw-dropping, behind-the-sofa-smuggling, expensive shopping list, it will be a stash list for what you already have! Oh Joy!

Click on it to open up all the colour options, and now find a colour which approximates to the thread in our own stash. OK you may have hand-dyed thread, that is tricky, but find something as close as possible.

When you have made your choice, double click, and the colour on your palette will change, along with any stitches on the chart that used the old colour.

Now right click on the colour you have chosen and you will be given the option to rename it.

Choose that option and a little tab pops up so you can enter your thread name and shade. Now when you come to print out the thread information for stitching your chart, you will have a list of your threads and the amounts you require of each. So, tomorrow, we will look at how you produce that list. And it won't be a jaw-dropping, behind-the-sofa-smuggling, expensive shopping list, it will be a stash list for what you already have! Oh Joy!
Thursday, 16 September 2010
Changing the Colour of your Motifs
 It is quite straightforward to change the colours of your motifs to those you prefer. Simply chose a new colour from the palette, then click on the cross-stitch on your left hand tool bar. Now you can change the colour stitch by stitch....but if you want to change a whole block quickly then in addition to clicking on the cross-stitch motif, click on the paint can on the top tool bar and pour the colour into the colour of the motif you want to change and a whole block of connected colour will change quickly. Two points for you to remember: First if you tip the paint can into the background by mistake, the whole background will be recoloured and you will go into shock. Take a breath, go to Edit on the top tool bar and choose Undo. Breathe away. Second the paint can only deals with connected blocks and on the swan motif you see here, those diagonal lines are not connected, so you will have to deal with them for now one stitch at a time.
However, when we move on to talk about the motif library, I'll show you a little trick that will let you change the colour of the whole motif in under 10 clicks. But next I want to help you fit the colours on your chart to the stash you already have - think of all the money you can save!
Wednesday, 15 September 2010
Creating a New Sampler from your Motifs
 There are a number of ways to put together your motifs in order to create a new sampler design. In this stage we are going to go through the basic steps of clipping a motif from one of your Infinity charts to paste in a new file in order to create your own sampler design. Open up your master Infinity motif chart and immediately rename it by saving it with a new file name to prevent your accidently deleting or making unwanted alterations to your master chart. Now you can start to move motifs. In order to move a motif you will need the lasso tool which you can find at the top of your side tool bar. Click on the tool and then use it to stretch a box around the motif you want to transfer. (Don't worry if you also capture fragments of other motifs in the process). Be precise with your lasso - simply because it will help you when making precision pastes to know exactly where the top corner of the the motif is, rather than having to remember the motif is three square to right of the top of the lasso and five squares down. Be kind to yourself and take time to position the lasso, if you don't get it right first time, you will succeed the second or third time.
 Once lassoed, click Edit on the top tool bar and choose Copy. Now you need to open up a new file for your new design. To do this click on File: New
Now you have a new file and you can paste by clicking your motif exactly where you want it to be.
 Once you paste your motif, though, the paste bucket comes back like chewing gum stuck to your fingers. At the moment it seems annoying to you, but remember the paste bucket is there to help you when you want to repeat elements along a row or in a sequence simply by clicking your mouse. For now you can dismiss it by clicking on Edit to the left of your top tool bar. Take care you don't hit this low and click Undo! (If you do click Undo by mistake there's not much harm done, just go back to the top tool bar and click Edit: Paste and repeat your paste.)
 Now you have your motif pasted down in your new chart - but it has a bit of flotsam and jetsam attached to it. You can use the erase tool on the side bar to clean up your design, or use the lasso tool again to box in the elements you don't want and then hit the Delete key on your keyboard to make them vanish. If you are wanting to paste your motif next to a motif you have previously pasted and you are concerned that the flotsam and jetsam will interfere with your design. Then find a clear space on your chart to past the motif, clean it up, then lasso it, and cut and paste it to its final position.
Now save your new chart and name it before returning back to your master chart to collect another motif. When you are ready to paste your second motif, choose File on the top tool bar and choose your destination file from the recently used files at the bottom of the File Menu. You will soon get into the rhythm of copy, toggle file, paste, save new file, toggle file, copy etc.
Before continuing with more advanced move options, we'll look tomorrow at recolouring, and then how to make your palette match your stash.
Tuesday, 14 September 2010
My Chart Has Vanished! - Using the Locator Window

It has happened to me once or twice, long ago, that when I opened up a chart I saw - it had vanished! I missed a heartbeat or two, fearing the chart was lost or corrupted. Then I discovered Locator Window. This is how to use it. On the top tool bar click on View then run down the menu and click on Locator Window.

Now you should be able to see a clump of colour in the window which is your chart - just hiding in the big expanse of spare design space you have. The rectangle defines your active viewing space so just push the rectangle over the clump of colour and your chart will appear before your very eyes. The locator window will stay with you until you dismiss it by clicking on the cross to close it.

If you want it to be there the next time you open your chart, so you don't go into crashcart mode again, you can simply park it out of the way on the area to the right of your screen. try it now for yourself.
Monday, 13 September 2010
Help, Support and Registration

I can help you with most issues relating to your CSD software. So you can post your questions here and I will answer them.
There may be a circumstance which involves the set up of your machine and the interaction with the software when I cannot help, but fear not, you have a fully licensed product and it is supported by FOCUSMM and you can find their contact details by going into Help on your tool bar.
 I do urge you to register your product - here is the link for registration:
http://ww2.focusmm.co.uk/eregister/default.aspx. Just enter your details, state that you bought your product from Needleprint and your product code is ESS408/D. You will not be sent follow up information unless you check boxes but you will obtain a code for 20% off future purchases from FOCUSMM
Sunday, 12 September 2010
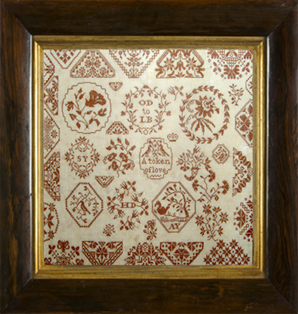
A View of Your Beatrix Potter Chart
 After the Welcome Screen, when you open up your Infinity Starter Kit with the Beatrix Potter Infinity Chart, this is a portion of what you will see. It is really important now to save the chart with a different name before you start to edit and change colours, otherwise you will overwrite your original. And no, you won't be the first. And yes, I have done that too! Simply go to the left side of the top tool bar and choose File then choose Save As and enter a different file name such as Beatrix Potter My Edit 1 on the pop up menu and browse to place your file in a suitable folder for future use.
Saturday, 11 September 2010
Time to Say Goodbye to the Welcome Screen
 It's always nice to be greeted by a cheery face, but perhaps after a while you just want to get down to work and not to have to bother dismissing that welcome screen. Here is the answer to your wishes. Look down on the Welcome Screen, underneath the Copyright Notice, and click on the white box labelled Don't show again, then click the OK button and say Goodbye Welcome Screen - Forever.
Friday, 10 September 2010
New Infinity Master Class Starts Today
 Thanks again to one of your excellent suggestions, I shall begin again the Infinity Master Classes - they do have their own dedicated blog: www.needleprintinfinity.blogspot.com where we can exchange tips and ideas on how to get the best from your Needleprint Infinity Charts and software. The Infinity starter kit, as some of you already know, includes the software to read Needleprint Infinity charts in such a way that they can be edited, recoloured, printed out, extracted from, combined with other motifs or combined with your own work. Because I wanted you to have something immediately to work on, we bundled the charting software with two Infinity charts we had to hand both of which you are very familiar with - The Beatrix Potter and Mary Wigham Samplers - old friends to make you feel at home. We have released a number of charts and motif libraries for download in PDF format and all come with a bonus editable Infinity files - so if you would like to get the most from your purchase, this is something for you to consider. There is a fact sheet available telling you more and you can simply click here to download it.
Subscribe to:
Comments (Atom)


