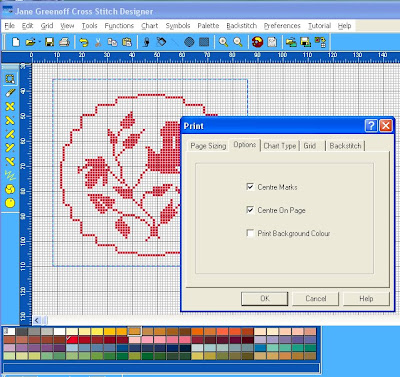
 It is good to have some pictures again to help explain what we are trying to do. The first thing you can see here is that I have copied a motif from the Beatrix Potter sampler and pasted it into a new file. So it takes up very little space in my work area. Before going on to print it, I have picked the Lasso Tool from the right Tool Bar and have used it to bound the area I want to print. And it is precisely these blocks which will appear on the print-out. The question is, how will they appear? Just to refresh, to get to this Print Option block, I have selected File from the top left of the Top Tool Bar and run down the menu to choose Print. The uppermost tab on the block is the Page Sizing Tab which we have already explored. And so I have moved on and selected the next tab in the Print block - Options. Here I can opt whether or not to show Centre Marks. I think they are very useful and so have decided to print them. These appear on the outside border of the chart as 4 triangles pointing to the centre of the chart. I have also opted to centre the chart on the page - it is always easy on the working eye to have a pleasing, symmetrical arrangment on the page. If you do not choose this option, your chart will be positioned at the top left of the printed page.
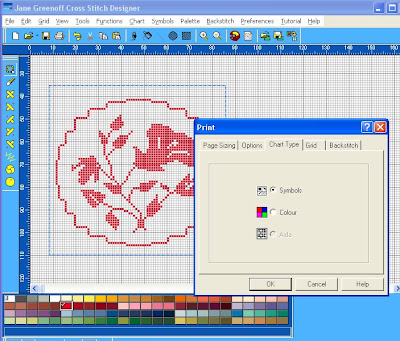
Let's move on to the next tab, now, Chart Type. I am printing this chart on my Laserjet printer so I have chosen to print black and white symbols - and I can do this even though my chart is still being displayed in colour. The Aida option will give you a background which simulates Aida Fabric which may be of interest to you.

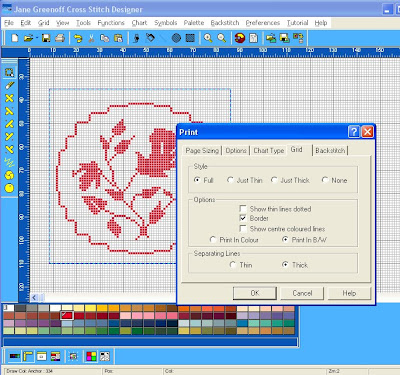
And we'll move along again to the next tab - Grid. I have chosen the Full Monty - to print both thin and thick grid lines. I could have chosen just the thin lines in which case the periodic thick lines so easy for counting off stitches would not appear, but maybe if you are printing a small excerpt they might not be necessary or aesthetic. The Just Thick lines is an interesting option which shows just the periodic markers with no grid lines in between. If someone can think up a use for this option they might like to share it. And the last option is no lines at all. Which you might like to use in combination with the colour Chart Type option to give people a quick impression of how your finished sampler will look when stitched, if you are not able to produce a stiched model for this purpose. Moving down a little - Show Thin Lines Dotted - you have to be joking....or have I missed something here? Show Border? It gives a pleasing edge to your chart. Show Centre Colour Lines is a very useful option when printing in colour. Because I have opted to print black and white symbols on the Chart Type, I choose Print in B/W here. And finally, the last row, Separating Lines Thin - only if you have eagle eyes, choose Thick if you prefer an easy life.
I won't go into the final tab now which relates to how Backstitch is printed, but we shall look at some Blackwork in a later lesson when all will be explained. Tomorrow we'll look at how you can export your chart.


